![]()
Objective
This project aims to forecast corporate bond spreads using historical market and macroeconomic data. The analysis demonstrates exploratory data analysis, feature engineering, and multiple time series and machine learning models. The final output highlights a linear regression model with lagged features as an interpretable and robust forecasting tool.
0. Browse Notebooks
| Notebook Link | Description |
|---|---|
| 01_data_collection.ipynb | Data collection and merging |
| 02_EDA.ipynb | Exploratory data analysis and feature engineering |
| 03_Modeling.ipynb | Time series and machine learning modeling, hyperparameter tuning, final model export |
1. Datasets
The dataset includes:
- Corporate bond yields
- 10-year Treasury yields
- VIX (market volatility index)
- CPI (Consumer Price Index)
- Fed Funds rate
The corporate bond spread, our primary target, is calculated as:
Spread = Corporate Bond Yield - 10-Year Treasury Yield
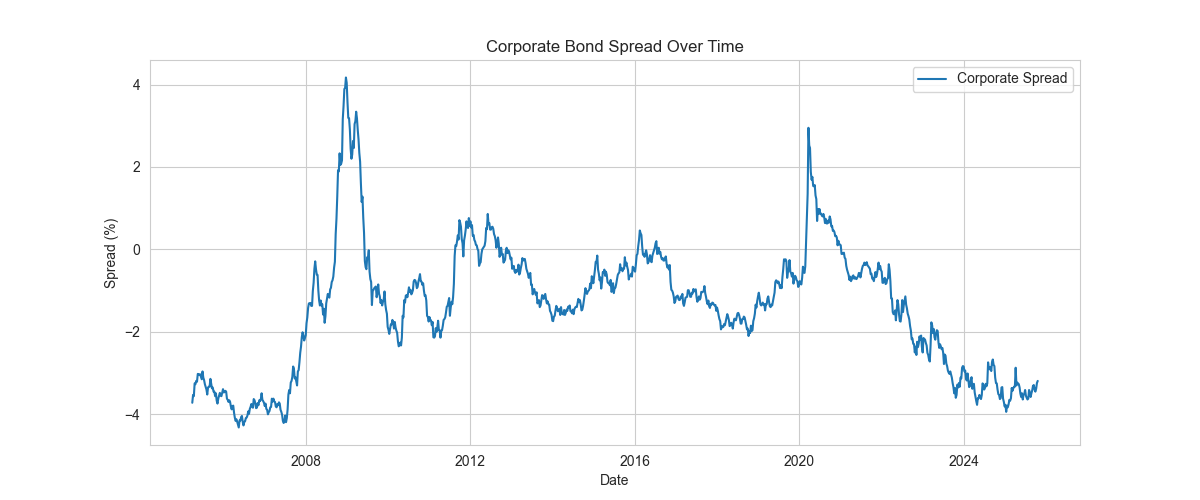
2. Exploratory Data Analysis
Corporate Spread Over Time
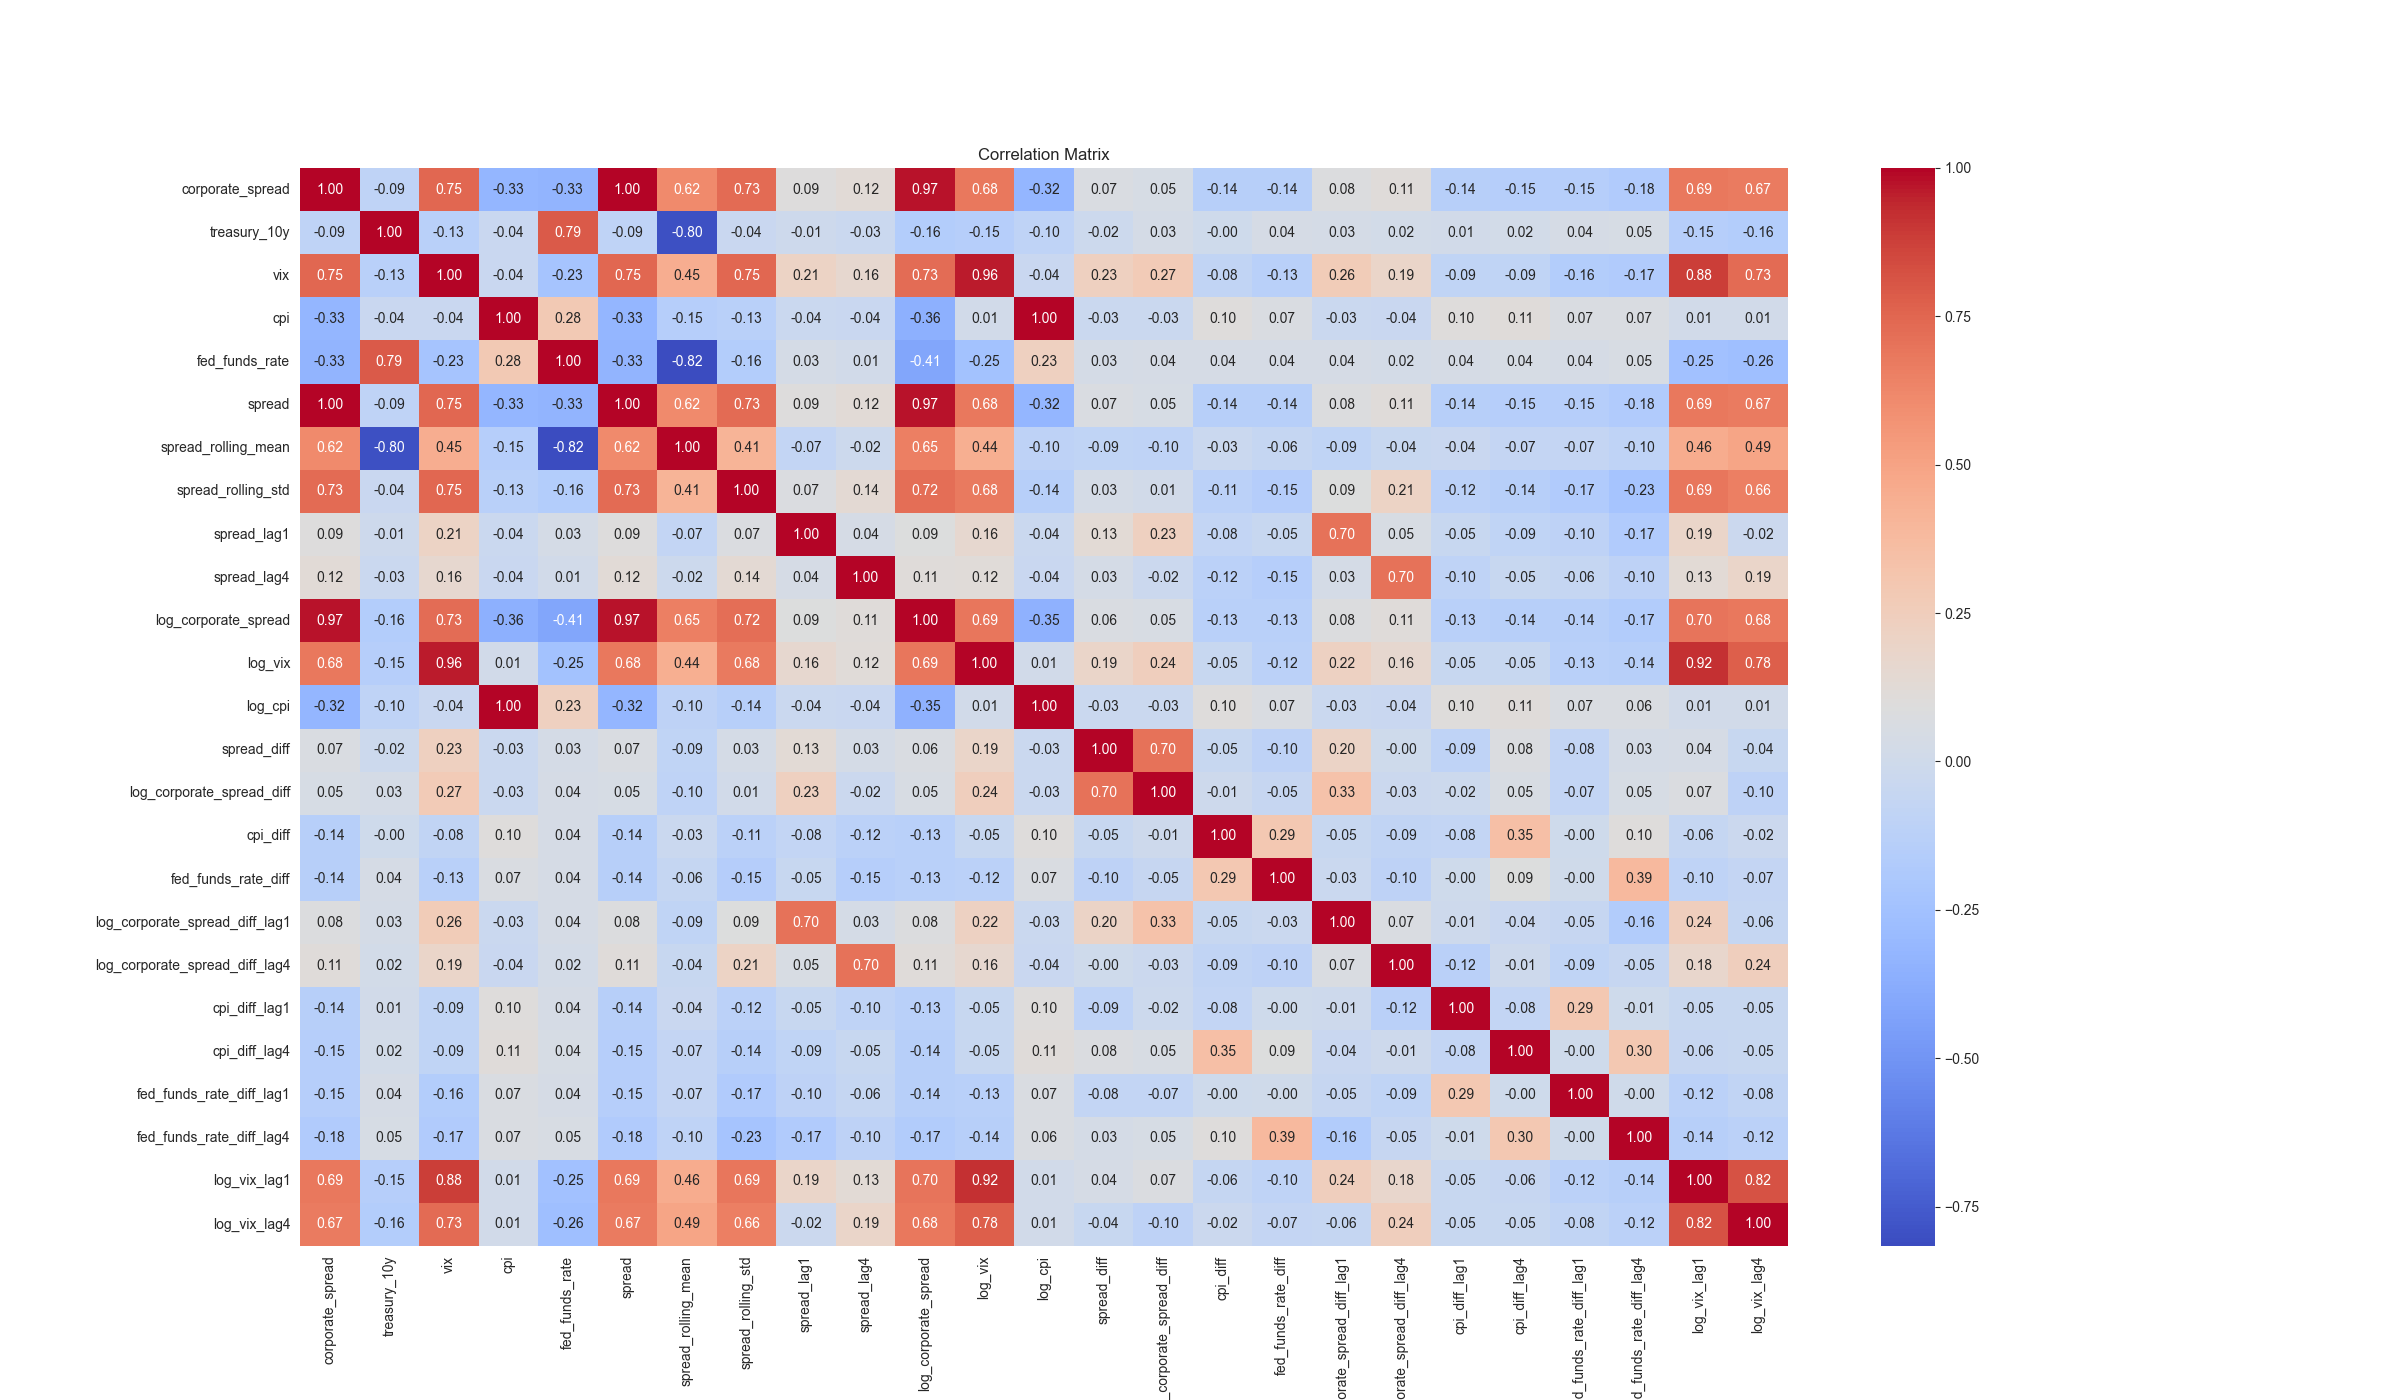
Correlation Structure
3. Forecasting Models
ARIMA
Captures autocorrelation in the spread series. 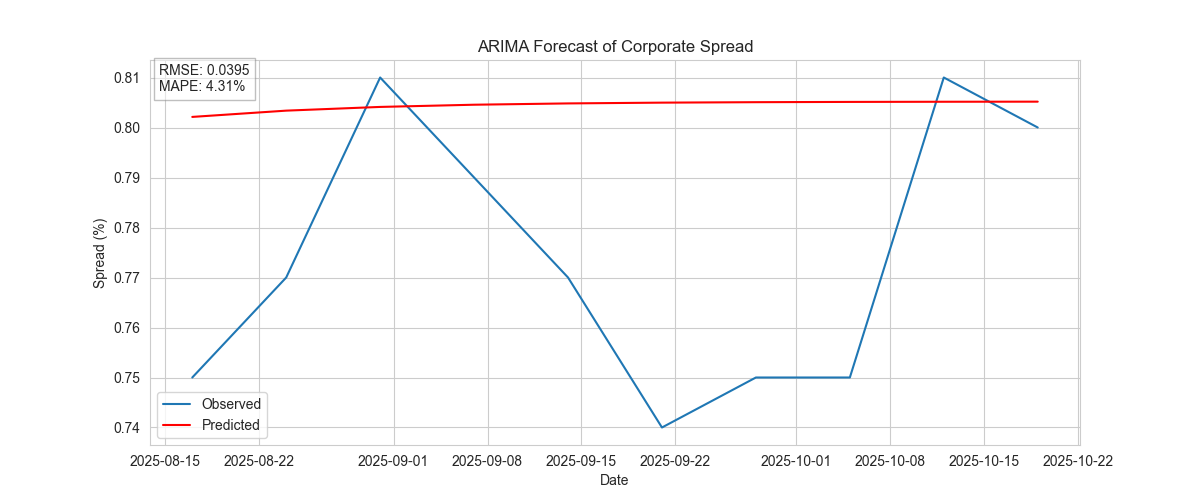
VAR
Incorporates interdependencies between spread and macroeconomic variables. 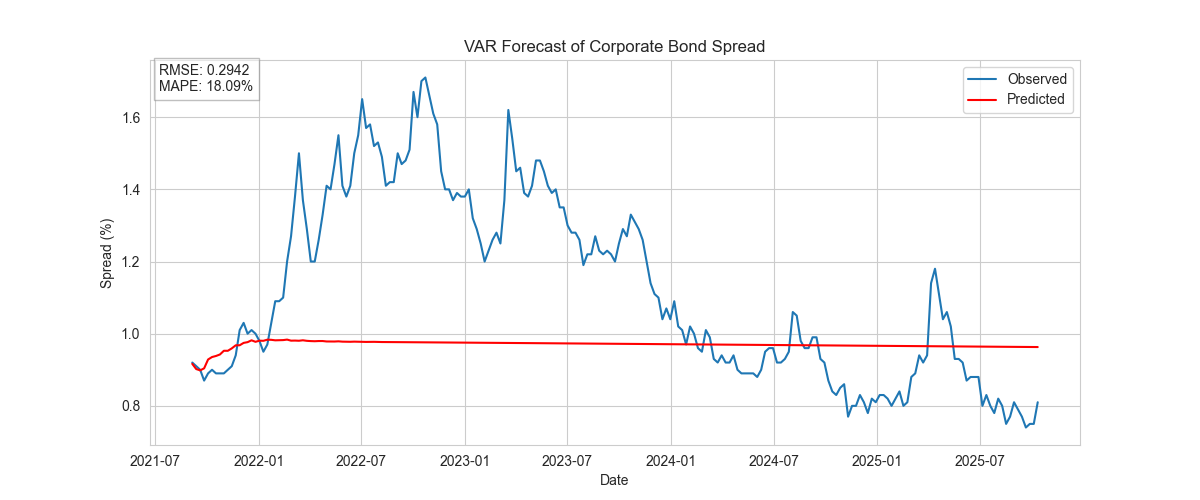
SARIMA
Accounts for potential seasonality in the spread. 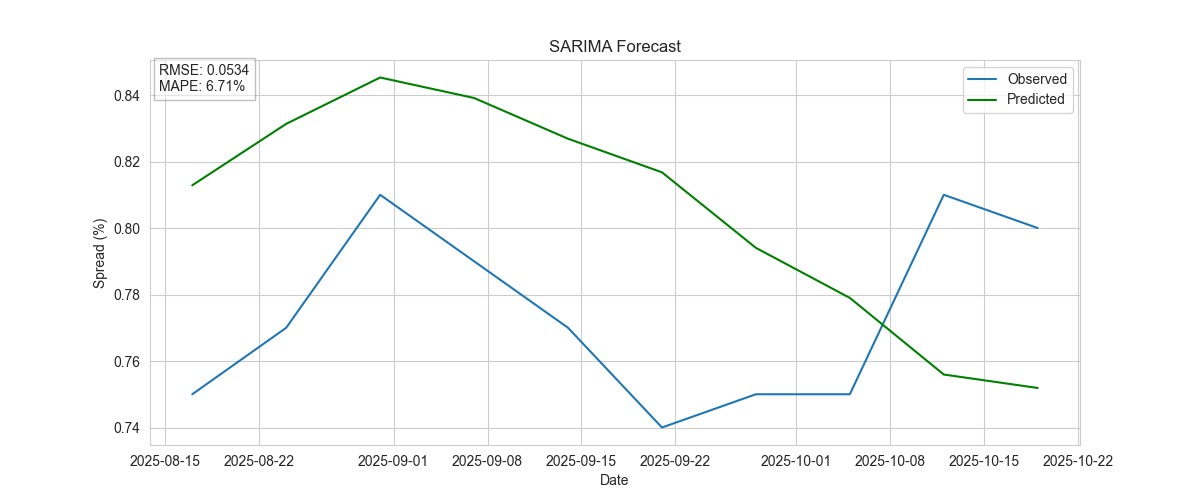
Holt-Winters
Captures both trend and seasonal components for robust forecasting. 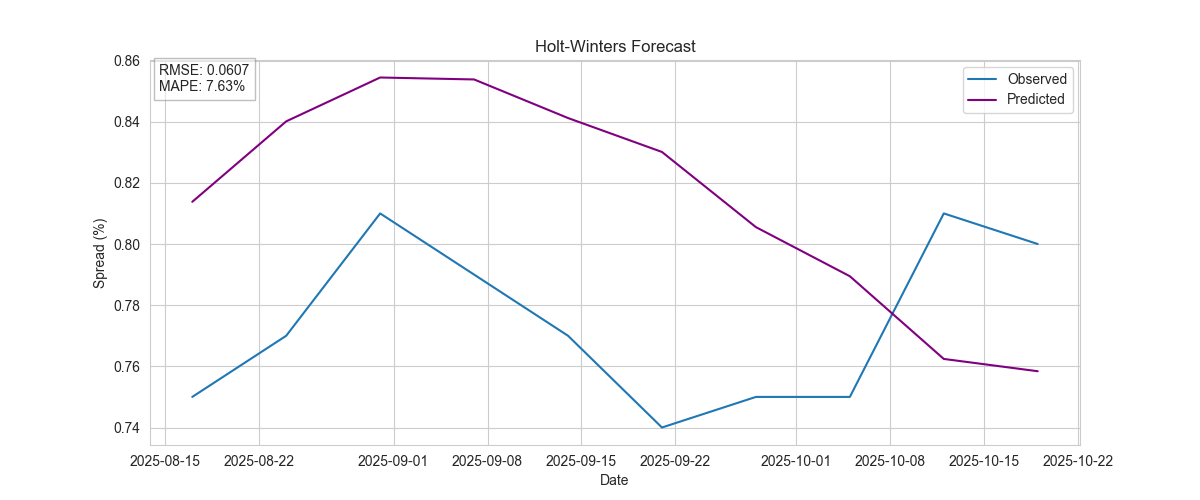
Regression on Lagged Features
Simple linear regression with lagged spreads and macro variables. 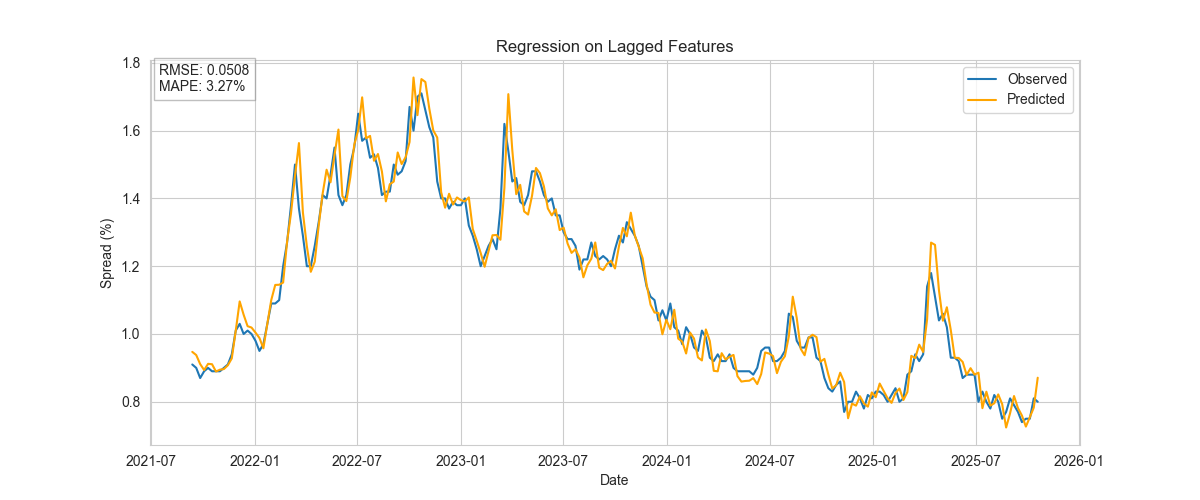
Gradient Boosting
Non-linear tree-based model capturing complex interactions. 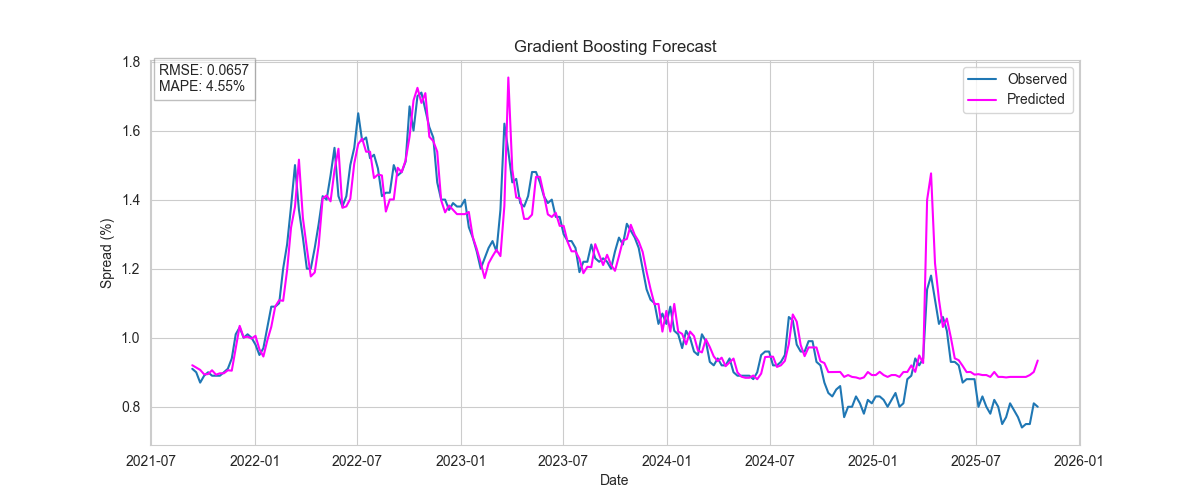
Random Forest
Ensemble model with robust performance and low sensitivity to hyperparameters. 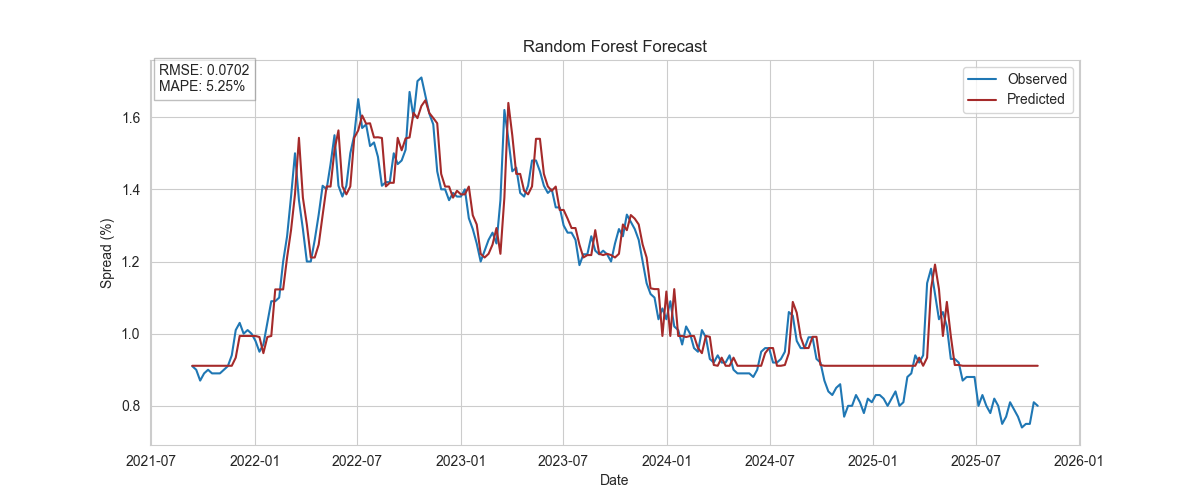
Final Linear Regression Model
Interpretable model using five lagged spreads and macro variables. 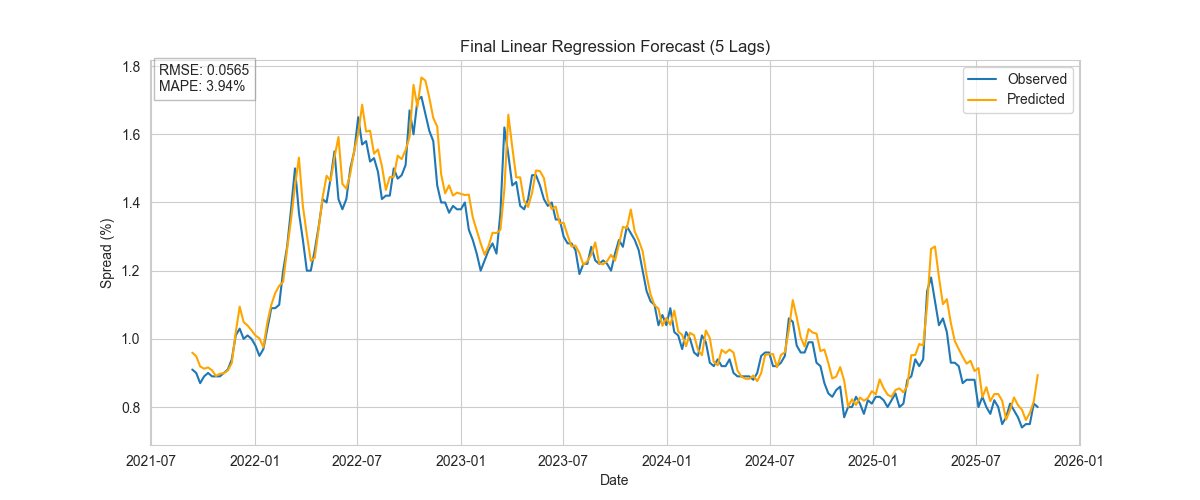
4. Feature Contribution
| Feature | Coefficient | Impact |
|---|---|---|
| spread | 0.9594 | 1.6013 |
| log_vix | 0.1356 | 0.3959 |
| cpi | -0.00016 | -0.0372 |
| fed_funds_rate | 0.00568 | 0.00734 |
Interpretation: Lagged spreads dominate the forecast, reflecting strong autocorrelation. VIX contributes meaningfully to risk adjustments. CPI and Fed Funds rate have minor short-term influence.
5. Model Evaluation
Models are evaluated using root mean squared error (RMSE) and mean absolute percentage error (MAPE).
- RMSE quantifies the average magnitude of forecast errors, penalizing larger deviations.
- MAPE expresses errors as a percentage, providing an intuitive measure of forecast accuracy across varying scales.
These metrics are standard in quantitative finance for short-term risk and spread forecasting.
Key Observations:
- Linear regression with lagged features outperforms more complex tree-based and ARIMA models in rolling out-of-sample validation.
- Walk-forward validation provides a realistic estimate of forecast performance, avoiding data leakage.
6. Project Artifacts
Notebooks
| Notebook | Description | Path |
|---|---|---|
01_data_collection.ipynb | Data collection and merging | Notebooks/01_data_collection.ipynb |
02_EDA.ipynb | Exploratory data analysis and feature engineering | Notebooks/02_EDA.ipynb |
03_Modeling.ipynb | Time series and machine learning modeling, hyperparameter tuning, final model export | Notebooks/03_Modeling.ipynb |
Models and Outputs
| File | Description | Path |
|---|---|---|
final_lr_model.pkl | Trained linear regression model | model/final_lr_model.pkl |
feature_impact.csv | Feature contribution table | model/feature_impact.csv |
predictions.csv | Observed vs predicted spreads for test period | model/predictions.csv |
7. Insights and Takeaways
Feature Engineering
Lagged spreads and macroeconomic transformations are critical for accurate short-term forecasting.Model Selection
Linear models offer interpretability and stability; tree-based and ARIMA models may require more data or hyperparameter tuning.Interpretability
Coefficients provide actionable insights into which features drive spreads, supporting quantitative risk management decisions.Robust Forecasting
Walk-forward validation ensures models generalize to unseen data, providing a realistic measure of prediction risk.
8. Conclusion
An interpretable linear regression model with well-engineered lag features provides robust short-term forecasts for corporate bond spreads. While complex models capture non-linearities, the linear approach balances accuracy, stability, and interpretability, aligning with quantitative risk management objectives.
All plots, forecasts, notebooks, and model artifacts are included above for full transparency of methodology and results.