![]()
Dashboard:
Blue Bikes (formerly, Hubway) is owned by the municipalities of Boston, Brookline, Cambridge and Somerville, and operated by Motivate International, Inc in Boston, MA.
Snippets:
Stations 
Trips 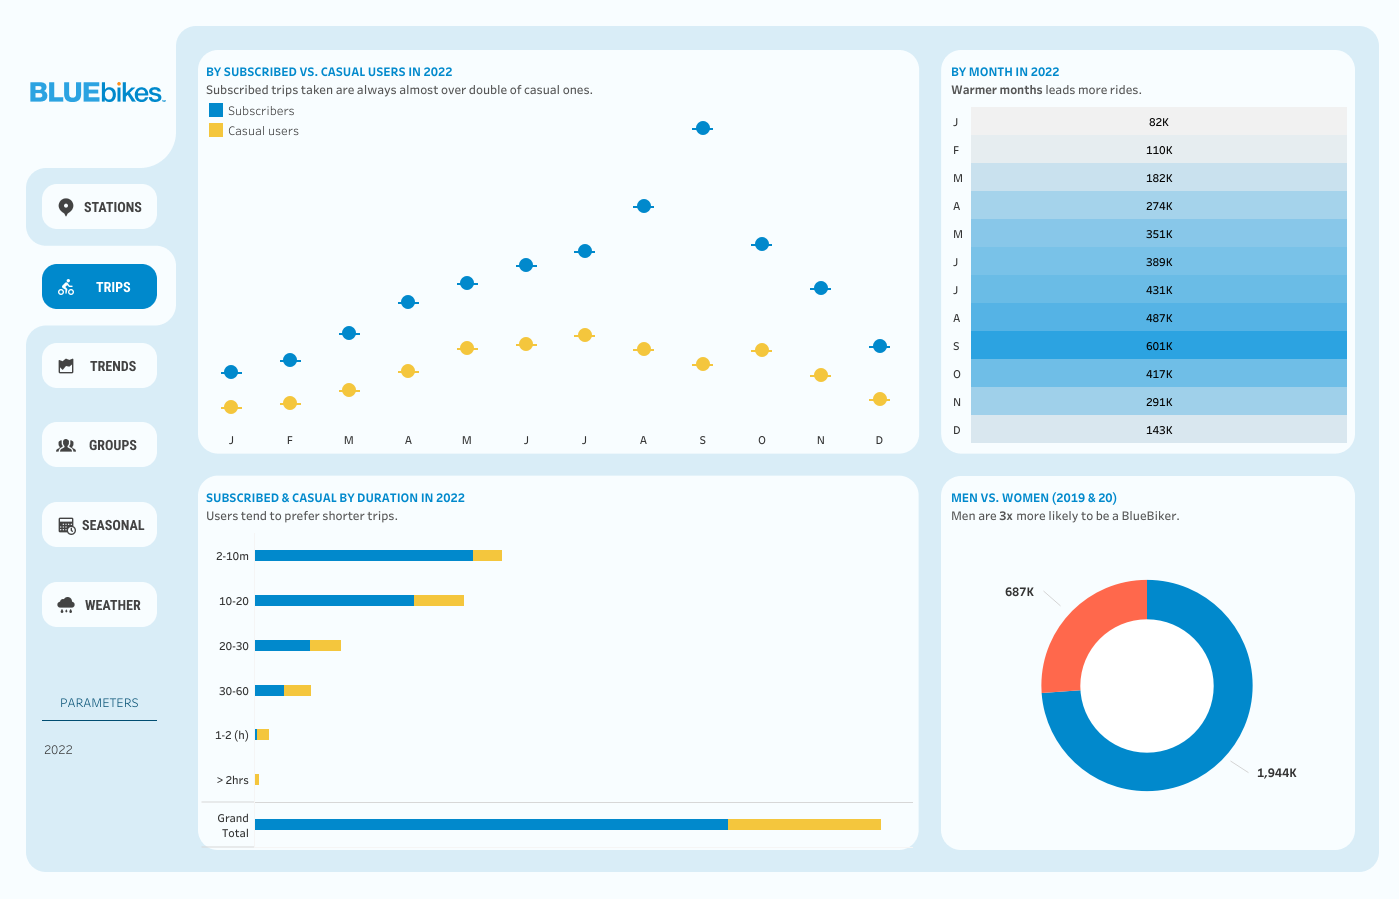
Trends 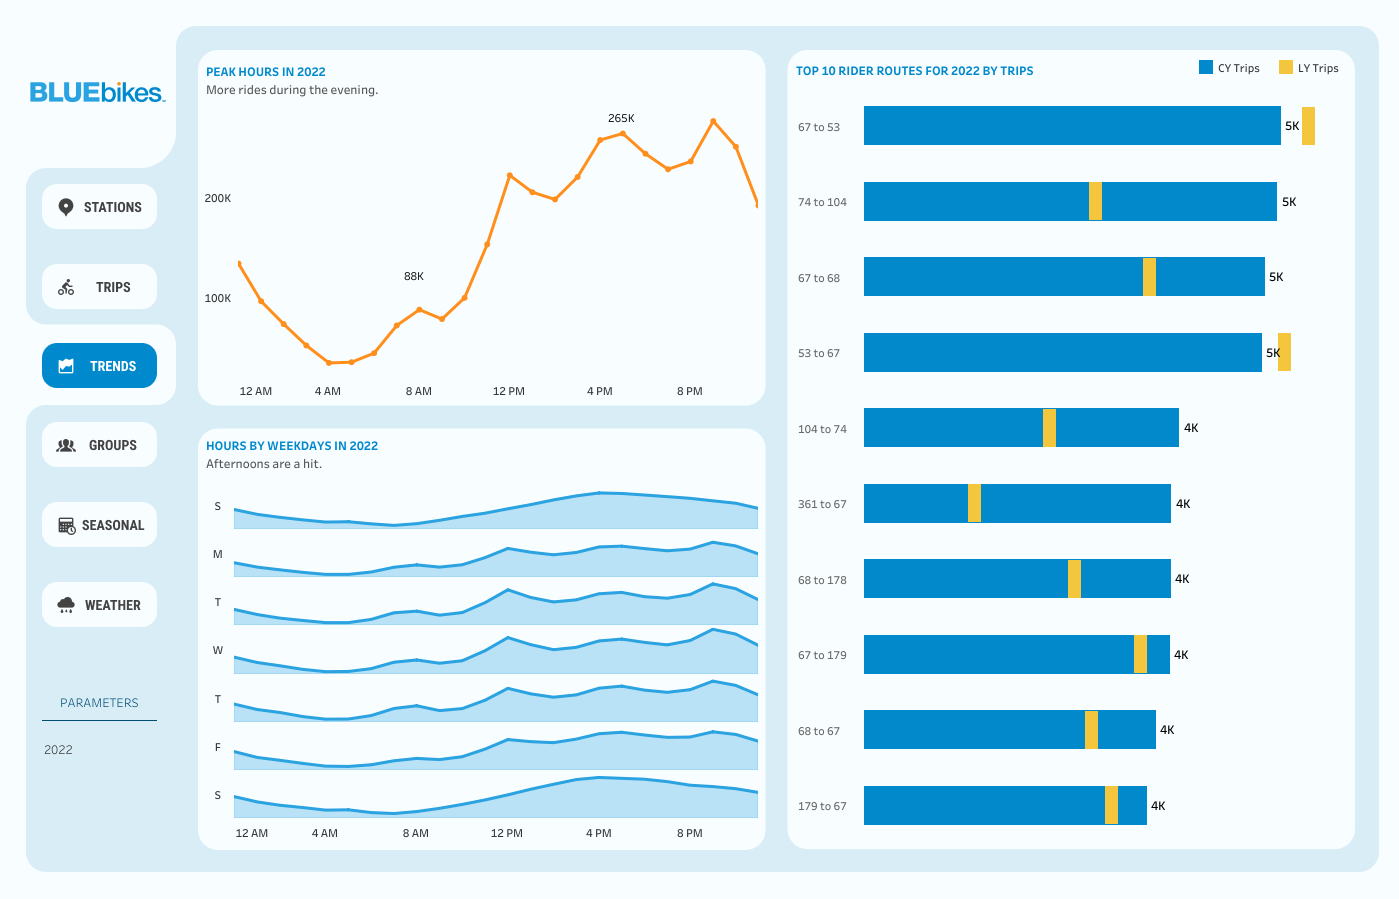
Groups 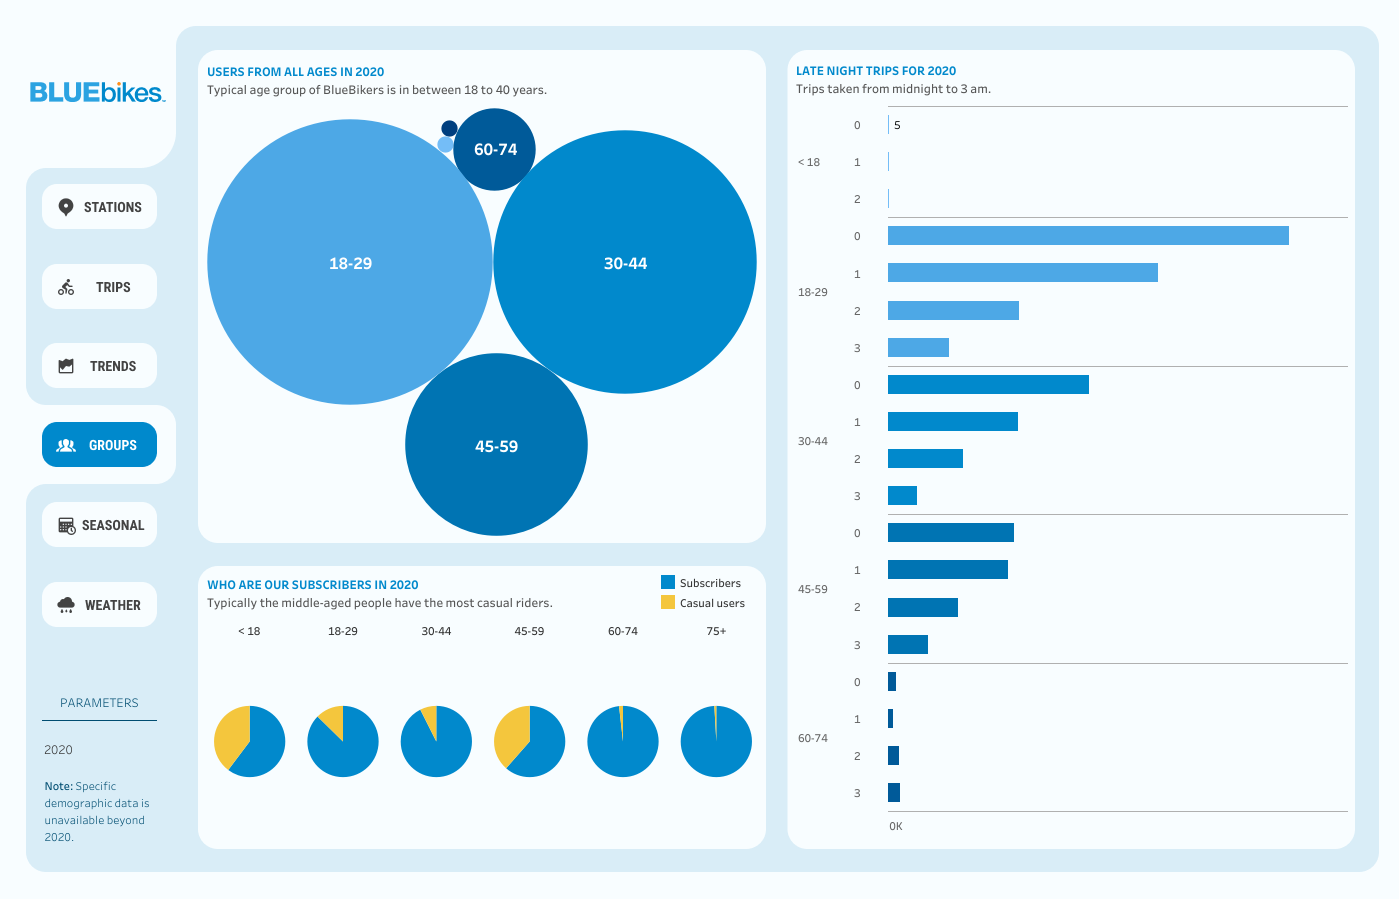
Seasonal 
Weather 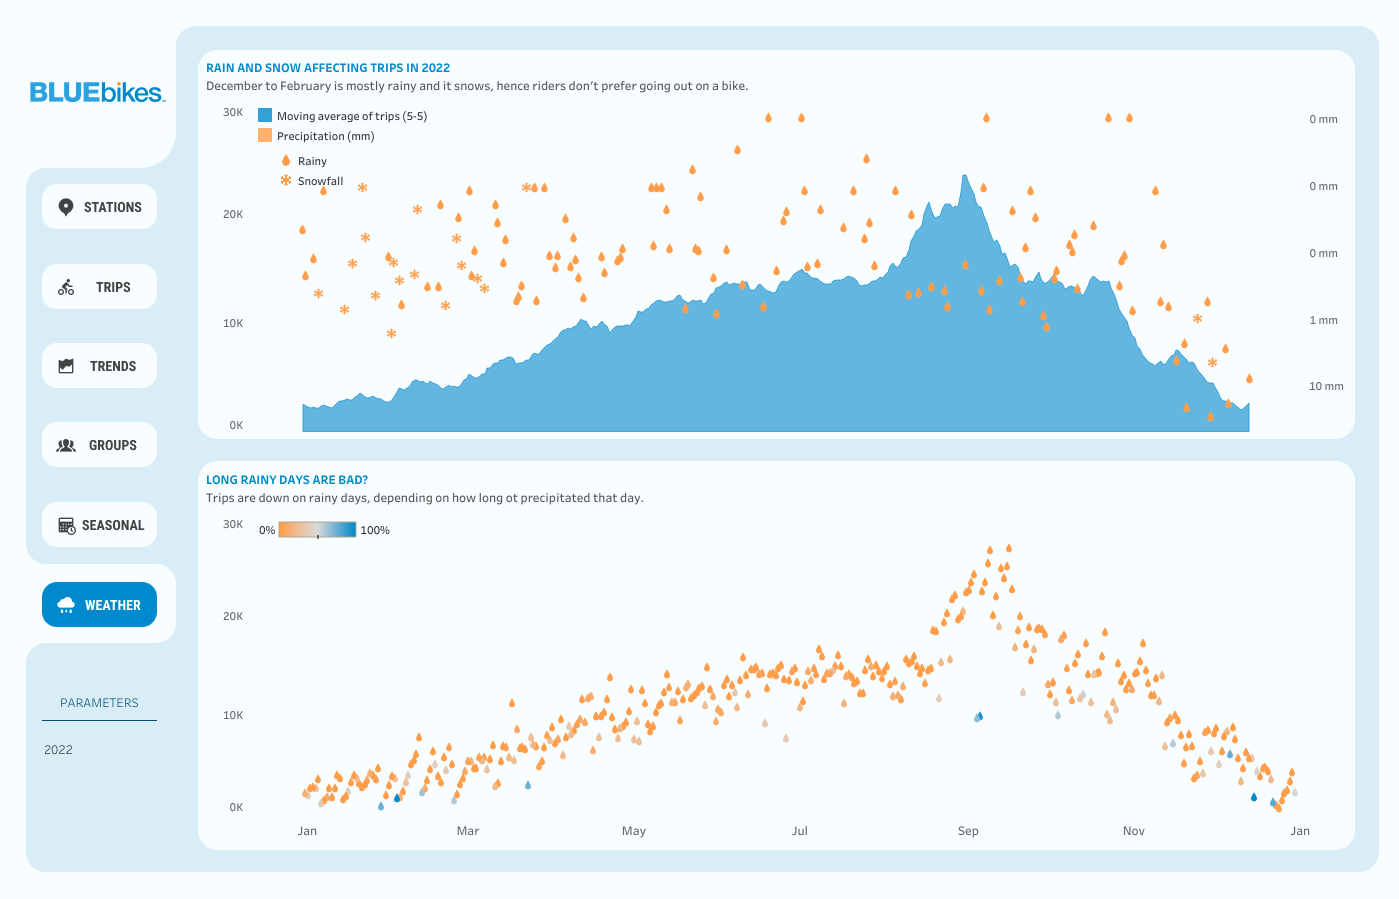
Data Source:
The datasets used in this project are provided by Blue Bikes (Motivate International, Inc.)
It includes:
- Comprehensive set of trip histories which is updated each annual quarter
- Real time system data, published in open General Bikeshare Feed Specification (GBFS) format - a format recommended by the North American Bike Share Association (NABSA).
Home: link
Dataset Bucket: link
Focus of the analysis:
- Locationwise station details and most and least used stations.
- Heatmap of trips for the last four years.
- Details about trips. How does the usual commute look like durationwise? Subscription wise.
- Trips taken by male and female Bluebikers.
- What are the peak hours and peak weekdays? What are the most frequently travelled routes, yearwise?
- Age groups. Subscription status by the age groups.
- Trips taken at late hours, Agewise.
- Trends of the trips taken. What were the busiest months? Estimation of total trips for the coming year.
- Weather conditions and factors that might influence Bluebikers.
Preprocessing:
Below are the steps performed using Pandas and NumPy on this notebook file in order to convert the collected data to a managable format which can be used for visualization.
Analyzing available features
Motivate International, Inc publishes their data each month, so in order to get a time series for 4 years, from Jan, 2019 to Dec, 22 which gives 48 seperate files. [As of 01/09/2023, Dec-22 is the last data published.]
- Merging Data in seperate dataframes by Year (2019, 2020, 2021, 2022)
- Extracting the Features from each set. Note: Since all of the years don’t contain same features and sometimes aren’t of same data type, processing them seperately was the best way of dealing with features since those features are important.
Available features:
| Name | Type | Description | Availability |
|---|---|---|---|
| tripduration | int | Duration in seconds | 19, 20, 21, 22 |
| starttime | string | Date Time in YYYY-MM-DD HH:MM:SS | 19, 20, 21, 22 |
| stoptime | string | Date Time in YYYY-MM-DD HH:MM:SS | 19, 20, 21, 22 |
| start station id | int | Start staion terminal id | 19, 20, 21, 22 |
| start station name | string | Start station name | 19, 20, 21, 22 |
| start station latitude | float | Latitude | 19, 20, 21, 22 |
| start station longitude | float | Longitude | 19, 20, 21, 22 |
| end station id | int | End station terminal ID | 19, 20, 21, 22 |
| end station name | string | End station name | 19, 20, 21, 22 |
| end station latitude | float | Latitude | 19, 20, 21, 22 |
| end station longitude | float | Longitude | 19, 20, 21, 22 |
| bikeid | int | Bike Number | 19, 20, 21, 22 |
| usertype | int | Subscriber or Casual | 19, 20 |
| birth year | int | Year of Birth | 19, 20 |
| gender | int | Male or Female | 19, 20 |
| postal code | int | Incomplete information | 20, 21, 22 |
Cleaning data:
Information related to records/year
| Year | Shape |
|---|---|
| 2019 | (2522771, 15) |
| 2020 | (2073448, 16) |
| 2021 | (2934378, 14) |
| 2022 | (3757281, 14) |
| Total | (11287878, 15) |
Data after Cleaning
Trip Data: NB: Files are not included with the repository. Again, source data files can be downloaded from here. link
| Name | Type | Description |
|---|---|---|
| tripduration | int | Duration in seconds |
| starttime | string | Date Time in YYYY-MM-DD HH:MM:SS |
| stoptime | string | Date Time in YYYY-MM-DD HH:MM:SS |
| start station id | int | Start staion terminal id |
| end station id | int | End station terminal ID |
| bikeid | int | Bike Number |
| usertype | int | Subscriber or Casual, [0, 1] |
| gender | int | NaN, Male, Female [0, 1, 2] |
| age | int | (birth year - starttime year) |
Data Added:
Collected station information from the availabe data:
Station Data: [View CSV]
| Name | Type | Description |
|---|---|---|
| id | int | Terminal id // Not unique |
| name | string | name |
| lat | float | Latitude |
| long | float | Longitude |
| street | string | Street name |
| city | string | Neighbourhood |
| county | string | County name |
| state | string | State name (MA) |
| zip | int | zip code |
Geocoding API:
Here we used Geocodeio’s link API for python to reverse geocode some of the referenced latitudes and longitudes to fetch geographical information and categorical features about the stations and terminal locations.
More on the implementation here at In [88] of this notebook. link
Unofficial package for Geocodeio Python API from bennylope/pygeocodio by bennylope. link
Implementation details
- Install Geocodeio
!pip install pygeocodio

from geocodio import GeocodioClient
client = GeocodioClient('KEY_HERE', timeout=300) #timeout: API conn. timeout
Produced List
| Parameter | Type | Description |
|---|---|---|
client.reverse() | List | Python List containing Lat Long information. |
Adding weather information to the analysis:
Also, added the Weather data for each day from Jan, 2019 to Dec, 2022 Used Visualcrossing’s link weather data here.
Weather Data: [View CSV]
| Name | Type | Description |
|---|---|---|
| datetime | string | Each day from Jan, 2019 to Dec, 2022 |
| temp | float | Temprature |
| dew | float | Dew |
| humidity | float | Humidity |
| precip | float | Precipitation |
| precipcover | float | Precipitation cover |
| preciptype | string | Precipitation type |
| uvindex | int | UV index |
Information related to discarded data:
- Since Postal code information was incomplete, we were unable to use that information. Instead later we collected the postcode of each station using Geocodeio API.
- Removed the redundant information containing ‘start station name’, ‘start station latitude’, ‘start station longitude’, ’end station name’, ’end station latitude’, ’end station longitude’.
Reduction in raw data size (total):
| Before | After | Reduction |
|---|---|---|
| 2.30 GB | 1.24 GB | ~ 46.08% |